SQL 2008 has a new feature called Change Data Capture (CDC). When enabled for a table it stores before and after values of the tracked columns in a change tracking table.
1. Enabling CDC for a database
To capture data changes for a table we need to first enable change tracking at database level. Execute the following script to enable CDC for the database.
use 'YourDBName'
go
exec sys.sp_cdc_enable_db
2. Setting CDC for the table
Use sys.sp_cdc_enable_table for a table to set CDC. By default, all
columns are tracked. We can strict CDC to specific columns by specifying column names for parameter ‘@captured_column_list’
exec sys.sp_cdc_enable_table
@source_schema = 'dbo'
,@source_name = 'Person'
,@role_name = 'rptrole'
,@capture_instance = 'Person'
/* This will create a change tracking table cdc.dbo_Person_CT */
,@supports_net_changes = 1
/* Indicates if support for quering net changes are allowed or not
allow = 1 */
,@index_name = 'PK_Person_PersonID'
/* change tracking requires a unique index to track changes against*/
,@captured_column_list
= 'Address1,Address2,City,State,Zip,PhoneNo,PersonID'
/* Changes will be tracked for columns mentioned in this parameter.
Default is all*/
,@filegroup_name = 'cdc'
/*file group where cdc objects will be created It’s a good practice to
create separate filegroup for CDC.Place the filegroup in a different
Drive to minimize impact on I/O
*/
-- ,@partition_switch = 'partition_switch'
/* Indicates if switch partition command is allowed or not.
applicable to patitioned tables only*/
3. Retrieving Change
Change data for the above example would be stored in cdc.dbo_Person_CT.It can be used in conjunction with cdc.lsn_time_mapping table to retrieve data for a time period. CDC provides functions for change retrievel as well.
Get Start LSN –
sys.fn_cdc_map_time_to_lsn('smallest greater than or equal', @begin_time)
Get End LSN -
sys.fn_cdc_map_time_to_lsn('largest less than or equal', @end_time)
Get net changes for the LSN range (shows only final content of a row for the range)
SELECT * FROM cdc.fn_cdc_get_net_changes_dbo_Person(Start LSN, End LSN,'all');
Get all changes for the LSN range (shows all changes for a row in the LSN range)
SELECT * FROM cdc.fn_cdc_get_all_changes_dbo_Person(Start LSN, End LSN,'all');
4. CDC Jobs
CDC creates a capture and cleanup job. Use the below SQL to see job configuration.
exec sys.sp_cdc_help_jobs
By default cleanup job is configured to retain up to 72 hrs changes and capture job is set to run continuously.
We can use sys.sp_cdc_change_job to modify the configuration of cdc jobs.
Saturday, November 8, 2008
Saturday, October 11, 2008
Handling Upserts Using 'Slowly Changing Dimension' in SSIS
Many of us would have faced a scenario where we have to bring in records from a source and insert if records don't exist or update if exists (also referred to as Upserts).This can now easily be done using 'Slowly Changing Dimension' (SCD) in SSIS 2005/2008.
In my example, I have a dimension table called dimPerson in Datawarehouse DB - 'DWDB' and a source table called Person in OLTP database - 'OLPTSource'.
My aim is to transfer records from OLPTSource.Person to DWDB.dimPerson based on these rules:
- If PersonID exists in DWDB and if there is any difference/change in columns FName, MName, LName, Address1, Address2, City, State or Zip then update the row with changes.
- If PersonID exists in DWDB and Phone number differs then mark the record as outdated and insert a new record for the PersonID
- If PersonID doesn't exists in DWDB then insert record
For this example you will need to create OLTPSource and DWDB databases and run the following script:
1. Create a Sequence Container to hold Data Flow task. Drag and drop
a Data Flow Task. Create two OLEDB connections :
OLE DB Connection for datawarehouse database – DWDB
OLE DB Connection for OLTP source database - OLTPSource
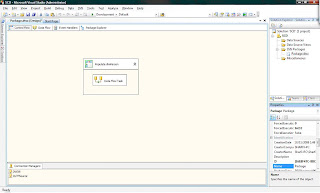
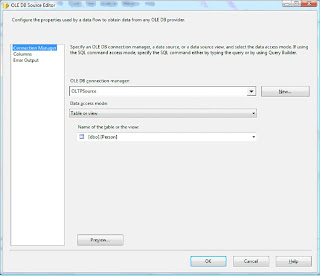
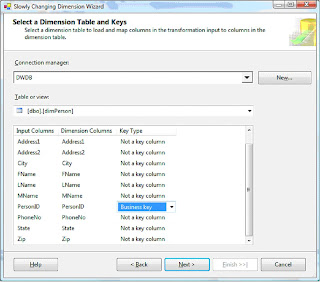
2. Go to Data Flow view and configure OLEDB data source to retrieve records from OLTPSource.Person table. Drag and drop ‘Slowly Changing Dimension’ item.
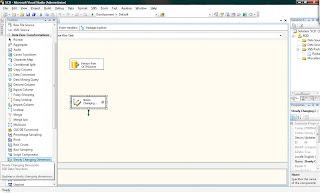
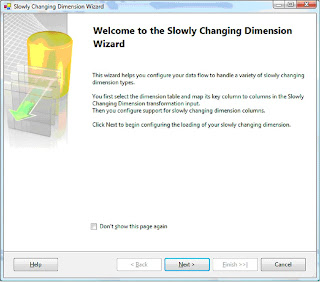
3. Double Click on SCD to bring up Wizard
4. Select Key Type as ‘Business Key’ for PersonID
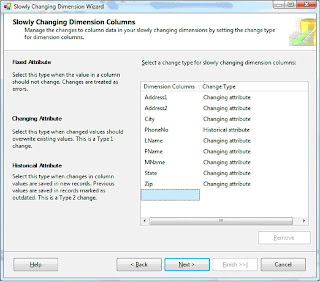
5. Select Change Type as ‘Historical Attribute’ for PhoneNo and ‘Changing Attribute’ for the rest.
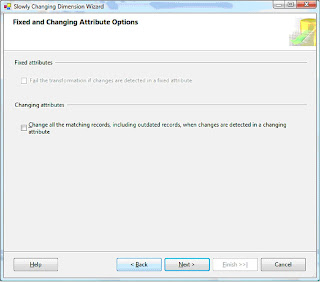
6. Don’t check any of the boxes in the below screen
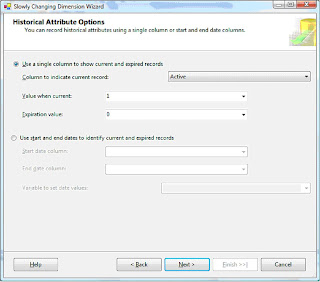
7. Select the column ‘Active’ to indicate current and expired rows. Enter 1 for current and 0 for expired value. If PhoneNo changes for a personID, then a new record will be inserted with a ‘Active’ column value of ‘1’. Old record will get the ‘Active’ column value updated to ‘0’.
8. Click finish on the next screen and you will notice that the wizard has updated items on the data flow view
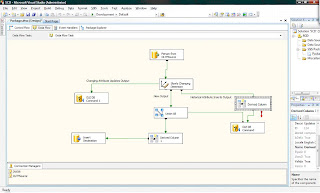
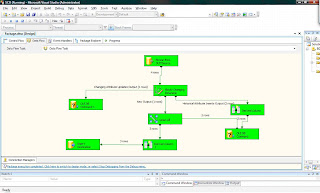
9. Excute the package. If you ran the whole script in http://docs.google.com/Doc?id=ddstdscf_0c653h9cm , then you will see a similar result as in screen below. There were two updates to PhoneNo column, that shows up as 2 rows in ‘Historical Attribute Inserts Output’. ‘New Output’ shows up as 1 row because of the one row inserted in the script. Finally, the ‘Change Attribute Updates Output’shows up as 1 because of the one update statement changing Zip and Addess1. Notice that the update statement for PhoneNo and Zip for PersonID =2didn’t change Zip for historical record (active =0). You can change this behaviour by setting UpdateChangingAttributeHistory to True.
Check below msdn link to find out what more on SCD:
http://msdn.microsoft.com/en-us/library/ms141715.aspx
In my example, I have a dimension table called dimPerson in Datawarehouse DB - 'DWDB' and a source table called Person in OLTP database - 'OLPTSource'.
My aim is to transfer records from OLPTSource.Person to DWDB.dimPerson based on these rules:
- If PersonID exists in DWDB and if there is any difference/change in columns FName, MName, LName, Address1, Address2, City, State or Zip then update the row with changes.
- If PersonID exists in DWDB and Phone number differs then mark the record as outdated and insert a new record for the PersonID
- If PersonID doesn't exists in DWDB then insert record
For this example you will need to create OLTPSource and DWDB databases and run the following script:
http://docs.google.com/Doc?id=ddstdscf_0c653h9cm
This will do the following –
- Create the two tables Person & dimPerson
- Populate Person & load dimPerson with Person records
- Update & insert statements to Person records to understand how SCD
handles these changes to source after the initial load of dimPerson
1. Create a Sequence Container to hold Data Flow task. Drag and drop
a Data Flow Task. Create two OLEDB connections :
OLE DB Connection for datawarehouse database – DWDB
OLE DB Connection for OLTP source database - OLTPSource

2. Go to Data Flow view and configure OLEDB data source to retrieve records from OLTPSource.Person table. Drag and drop ‘Slowly Changing Dimension’ item.


3. Double Click on SCD to bring up Wizard

4. Select Key Type as ‘Business Key’ for PersonID

5. Select Change Type as ‘Historical Attribute’ for PhoneNo and ‘Changing Attribute’ for the rest.

6. Don’t check any of the boxes in the below screen

7. Select the column ‘Active’ to indicate current and expired rows. Enter 1 for current and 0 for expired value. If PhoneNo changes for a personID, then a new record will be inserted with a ‘Active’ column value of ‘1’. Old record will get the ‘Active’ column value updated to ‘0’.

8. Click finish on the next screen and you will notice that the wizard has updated items on the data flow view

9. Excute the package. If you ran the whole script in http://docs.google.com/Doc?id=ddstdscf_0c653h9cm , then you will see a similar result as in screen below. There were two updates to PhoneNo column, that shows up as 2 rows in ‘Historical Attribute Inserts Output’. ‘New Output’ shows up as 1 row because of the one row inserted in the script. Finally, the ‘Change Attribute Updates Output’shows up as 1 because of the one update statement changing Zip and Addess1. Notice that the update statement for PhoneNo and Zip for PersonID =2didn’t change Zip for historical record (active =0). You can change this behaviour by setting UpdateChangingAttributeHistory to True.

Check below msdn link to find out what more on SCD:
http://msdn.microsoft.com/en-us/library/ms141715.aspx
Tuesday, August 5, 2008
IF Exists #tempTable
Lot of us would be using 'like' clause to check for existence of a local or global temp table.
if exists ( select name from sys.objects
where type = 'U' and
name like '##temptable%')
Drop table ##temptable
...
...
...
Create script for ##temptable
...
...
This code will run into problem if some other user connection is already having its own global temp table ##temptablex. Connection runnning the above script will try to drop the table since if exists condition evaluates to true and error out.
One way to avoid this is by checking object id for the temp table -
if (OBJECT_ID ('tempdb..##tempTable') is not null )
SQL 2008 Data Collector
SQL 2008 has a new feature called ‘Data Collector’. Data Collector monitors server and database performance. It comes with built in reports for the collection sets. We can setup a collection for SQL servers that will collect performance data at a central repository. This data can be used for troubleshooting performance issues and to see how the server is scaling. I did see some bugs with reports in RC 0, but they can be worked around.
Here’s how you can navigate to Data Collection -
SQL Server Management Studio > Object Explorer > Management > Data Collection
It ships with three collection sets –
Disk Usage
Query Statistics
Server Activity
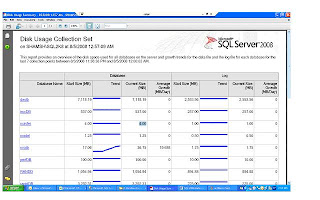
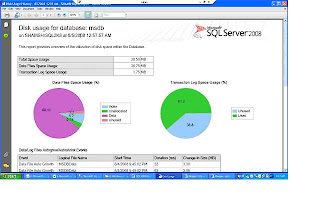
Disk Usage collection set gives statistics around database files. For Data/Log files you can see Auto Grow, Auto Shrink events, file growth trends, growth rates, disk space used by DB files etc.
Here’s how you can navigate to Data Collection -
SQL Server Management Studio > Object Explorer > Management > Data Collection
It ships with three collection sets –
Disk Usage
Query Statistics
Server Activity
Disk Usage collection set gives statistics around database files. For Data/Log files you can see Auto Grow, Auto Shrink events, file growth trends, growth rates, disk space used by DB files etc.


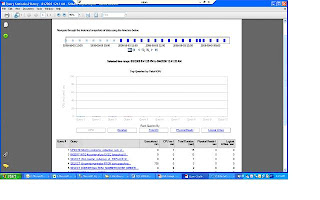
Query Statistics collection set gives statistics for queries that ran on the server. This was possible in SQL 2005 as well through DMVs(sys.dm_exec_query_stats, sys.dm_exec_sql_text, sys.dm_exec_query_plan ).
You can see following query stats on the report -
Executions /Min,
CPU ms/sec,
Total duration,
Physical reads/sec,
logical writes/sec
You can see following query stats on the report -
Executions /Min,
CPU ms/sec,
Total duration,
Physical reads/sec,
logical writes/sec

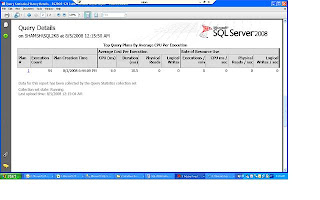
Click on a query to see details. You can then see waits by clicking ‘view sampled waits for this query’
Click on plan ids to see graphical execution plan.

Click on plan ids to see graphical execution plan.

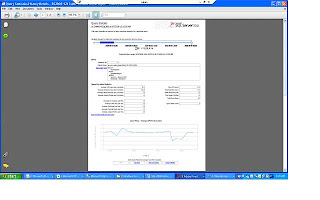
Server Activity collection set collects data for % CPU , Memory Usage , Disk I/O Usage , Network Usage, SQL Server Waits and SQL Server Activity. You can click on the individual graphs on the main report to get more detailed information. For example, you can drill down to different lock types for SQL server Waits collection.
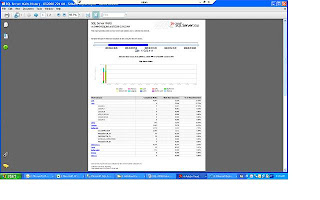
Just a caution before you decide on implementing this on prod…You should give due consideration to collection interval and data retention properties to keep it from having an impact on performance. I would suggest testing it out in a load test environment and see its resource usage.

Just a caution before you decide on implementing this on prod…You should give due consideration to collection interval and data retention properties to keep it from having an impact on performance. I would suggest testing it out in a load test environment and see its resource usage.
Wednesday, July 23, 2008
Auto Update Statistics DB Option
On my very first week at work, I had to work on a production problem that had been lingering over for a while. Users were reporting sporadic application timeouts and slowness. Perfmon Data, SQL sever logs, server event logs were all clean indicating no hardware issues. Analysis of PSSDiag Blocking log and trace files showed Auto update stats getting kicked off at the problem times.
SQL server starts Auto update stats when data modification for a table is more than 20 %. Auto update stats can degrade performance especially if the table in question is big.
Consider to turn this option off if this DB option becomes a problem for you.If you decide to turn this option off then handle update statistics through a scheduled maintenance job. We can look at rowmodctr column in sysindexes to get an idea on how many modification were made after stats were last updated. If you are running SQL 2005 or SQL 2008 try out Asyncronous Auto update stats option (AUTO_UPDATE_STATISTICS_ASYNC{ONOFF})
I didn’t have the luxury of this feature as this was SQL2000. I ended up turning auto
Update stats off and having update stats run as part of maintenance.
Here’s what you would expect to see depending on the tool you use.
SQL Profiler: You would see ‘auto stats’ event class in trace files. If you import the trace files in a table then look for trace event id 58
Blocking log: In PSSDiag blocking log ( ServerName_instanceName_Run_sp_blocker_pss80.OUT)
You would see syslockinfo records like below
Spid ObjId Type Resource Mode Status
63 1893058136 TAB [UPD-STATS] Sch-M GRANT
SQL Error log: To have sql server log auto stats event in error log, run dbcc traceon (8721, -1)
You will see entries like below in the error log –
2008-05-19 23:40:51.66 spid72 AUTOSTATS: SUMMARY Tbl: DeviceEvents
Objid:1893058136 UpdCount: 12 Rows: 1124361 Mods: 124776 Bound: 225372 Duration: 5500ms LStatsSchema: 11
Subscribe to:
Posts (Atom)