Lot of us would be using 'like' clause to check for existence of a local or global temp table.
if exists ( select name from sys.objects
where type = 'U' and
name like '##temptable%')
Drop table ##temptable
...
...
...
Create script for ##temptable
...
...
This code will run into problem if some other user connection is already having its own global temp table ##temptablex. Connection runnning the above script will try to drop the table since if exists condition evaluates to true and error out.
One way to avoid this is by checking object id for the temp table -
if (OBJECT_ID ('tempdb..##tempTable') is not null )
Tuesday, August 5, 2008
SQL 2008 Data Collector
SQL 2008 has a new feature called ‘Data Collector’. Data Collector monitors server and database performance. It comes with built in reports for the collection sets. We can setup a collection for SQL servers that will collect performance data at a central repository. This data can be used for troubleshooting performance issues and to see how the server is scaling. I did see some bugs with reports in RC 0, but they can be worked around.
Here’s how you can navigate to Data Collection -
SQL Server Management Studio > Object Explorer > Management > Data Collection
It ships with three collection sets –
Disk Usage
Query Statistics
Server Activity
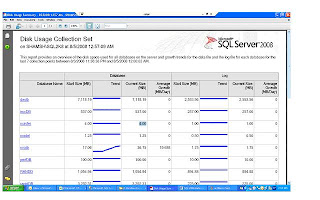
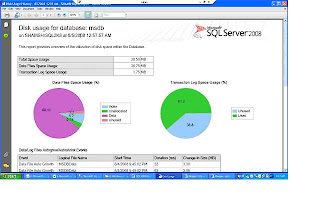
Disk Usage collection set gives statistics around database files. For Data/Log files you can see Auto Grow, Auto Shrink events, file growth trends, growth rates, disk space used by DB files etc.
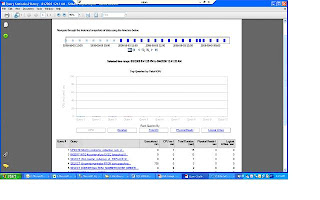


Query Statistics collection set gives statistics for queries that ran on the server. This was possible in SQL 2005 as well through DMVs(sys.dm_exec_query_stats, sys.dm_exec_sql_text, sys.dm_exec_query_plan ).
You can see following query stats on the report -
Executions /Min,
CPU ms/sec,
Total duration,
Physical reads/sec,
logical writes/sec
You can see following query stats on the report -
Executions /Min,
CPU ms/sec,
Total duration,
Physical reads/sec,
logical writes/sec

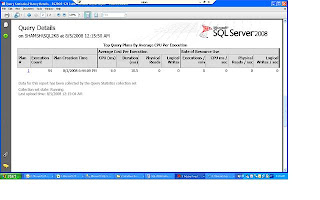
Click on a query to see details. You can then see waits by clicking ‘view sampled waits for this query’
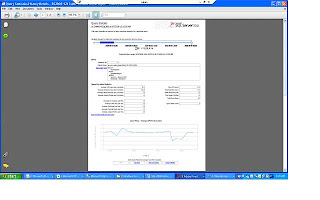
Click on plan ids to see graphical execution plan.

Click on plan ids to see graphical execution plan.

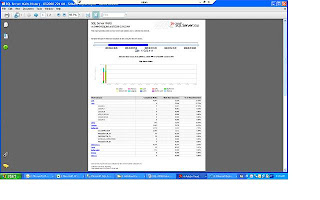
Server Activity collection set collects data for % CPU , Memory Usage , Disk I/O Usage , Network Usage, SQL Server Waits and SQL Server Activity. You can click on the individual graphs on the main report to get more detailed information. For example, you can drill down to different lock types for SQL server Waits collection.
Just a caution before you decide on implementing this on prod…You should give due consideration to collection interval and data retention properties to keep it from having an impact on performance. I would suggest testing it out in a load test environment and see its resource usage.

Just a caution before you decide on implementing this on prod…You should give due consideration to collection interval and data retention properties to keep it from having an impact on performance. I would suggest testing it out in a load test environment and see its resource usage.
Labels:
SQL 2008 Data Collector
Subscribe to:
Comments (Atom)